breakdown of data components |
Original Data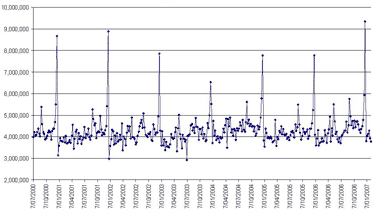
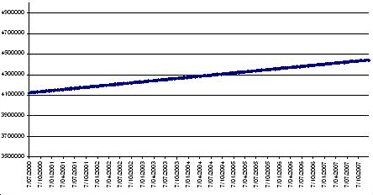
Trend
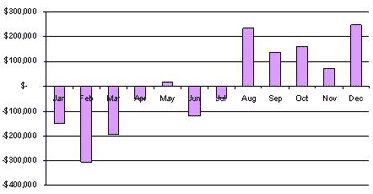
Seasonal Components
Noise
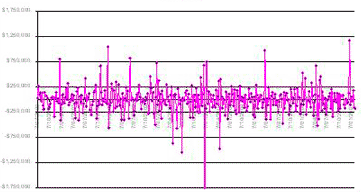
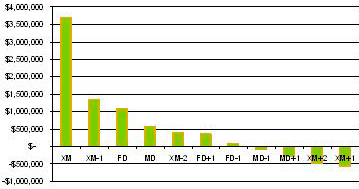
Special Week Components
Underlying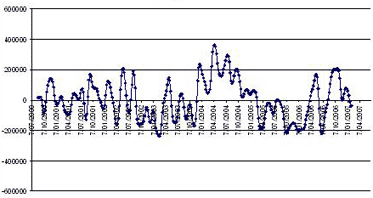
| services we provideStatistical Modelling, Forecasting & Seasonal Adjustment of Data |
Breakdown
When data appears noisy, it is difficult to properly analyse the underlying
movements. A dataset can be broken
into its component parts using a variety of techniques to enable analysis of:
- Trend
- Seasonalilty
- Smoothed Fluctuations
- Special Cases
- Noise
In the example on the left, the original data appears noisy and difficult to interpret. By breaking the information into several component parts, it is possible to uncover the various significant items and interpret them individually.
Trend
This is seen as only a small (but important)
part, growing at 1.7% p.a.
Seasonality
Sales in this example follow a yearly
seasonality where volumes in the latter part of the year are far stronger
than in the beginning.
Fluctuations
Once the other components are understood, a
smoothing function (such as Tukey’s 4253H resistant smoother) can be
applied to identify the other major movements within the data. By seeing these clearly and attempting to
match changes with known causes, better planning for future events can be
undertaken.
 |
 |
| find out more about us |
|
| download our credentials document |
|
| read about recent clients |
|
| ask us about your project |
|
| return to homepage |
|
 |
|
|
|
Suite 172 |
|
| 0423 567 444 |