project model |
| services we provideCost & Risk Model Simulation |
Introduction
Typically, during project evaluation, the values of certain variables in a model are assumed based on experience, best practice or by company directive.
Values such as discount rate, growth forecasts and initial capital outlay, among many others, are input to the commercial model to determine whether a project is cost effective (i.e has a positive NPV or an IRR greater than the company's prescribed target).
In reality, these values are not hard and fast fixed values. For example initial capital is an estimate that may vary around an average. Growth forecasts can often be educated guesses based on either historical data or ambitious targets and so forth.
Instead of entering values to a model and producing a single, all encompassing result using individual inputs, why not enter these as variables and let the model simulate thousands of "What-If" results so that a clearer picture of risk and project success can be gathered?
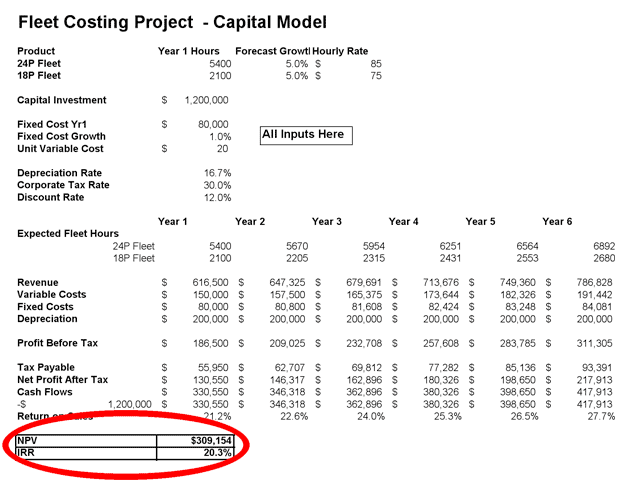
Take a look at the following example Project model. Based on the values as entered in the purple area, it shows a positive NPV and an IRR that is above the company prescribed value and as such, would possibly be presented as a viable project.
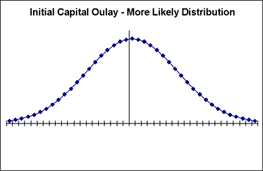
Now, instead of using an initial capital outlay of exactly $1,200,000, what if we use a more sensible and realistic estimation as shown on the following graph.
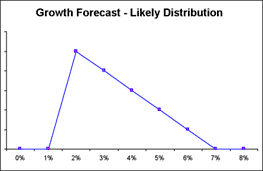
Similarly, the growth forecast may be more likely to be 2% or 3% with decreasing likelihood of higher values instead of just 5% and the distribution might look like this:
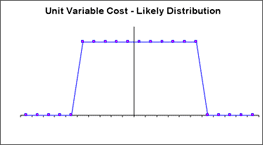
Finally, the variable costs in this example may actually fall within a possible range of $15 to $25 rather than being exactly $20 and might look like this:
Simulation Model
We are now in the position to put these random variables back into our initial Project model and let the modelling tool (Excel) produce a more comprehensive and detailed evaluation of the project parameters.
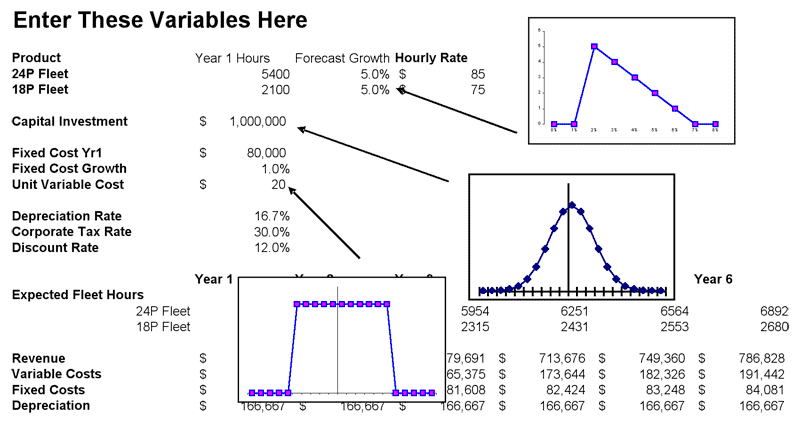
All we need do now is run a simulation in Excel several thousand times and review the potential project outcomes based on a more sensible and probable value for all the chosen inputs.
Results
The IRR and NPV graphs now look like this:
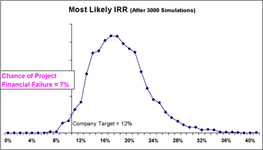
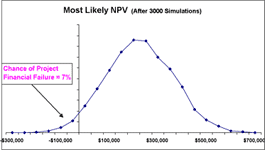
The original model gave values of:
NPV = $309,154
IRR = 20.3%
Although these values are "likely", it is clear from the evaluation that there is a wide range of possible outcomes, with some (7%) chance that the project actually fails. We can now put a rating on the various inputs and perhaps refine them to make a more informed selection regarding the go/no go decision.
Importantly, by using a range of values as inputs, we can gather the valuable and informed collective experience from several subject experts to create the inputs and collect their thoughts into a more encompassing and complete evaluation.
Conclusion
they're ... data consultants can assist in creating this type of analysis. It certainly allows more formal risk analysis and project evaluation and ensures that a broader and more rigorous study is made prior to proceeding with potentially risky investments.
The modelling, setup and operation is relatively straight-forward and able to be implemented in a short time frame with little modification to existing Financial models and spreadsheets and with limited assistance required.
We invite you to consider this modelling and evaluation tool as part of the process in creating valuable solutions for your customers.
 |
 |
| find out more about us |
|
| download our credentials document |
|
| read about recent clients |
|
| ask us about your project |
|
| return to homepage |
|
 |
|
|
|
Suite 172 |
|
| 0423 567 444 |